The Graphing Calculator And Dimensional Thinking
November 23, 2015
The Graphing Calculator And One-Dimensional Thinking
A graphing calculator requires the application of understanding to a concept in order to use that concept effectively. This enables the user to solve problems by visualizing them. While the use of the graphing calculator is primarily in the fields of math and science, changing the dimension of a given graph can be a pleasant diversion from the mundane.
One of the most familiar types of graph is the one-dimensional, real number line graph. With this type of graph each point on the line corresponds to a real number. The arrow on the end of this example indicates the direction in which the numbers get larger.

Most commonly used graphs have the increase going to the right.
With a little imagination and the appropriate equation, however, one can use a graphing calculator to turn an “ugly duckling” one-dimensional line graph into a beautiful “swan.”

The Graphing Calculator And Two-Dimensional Thinking
Using a graphing calculator to create a two-dimensional rectangular graph involves creating two sets of real number lines placed perpendicular to each other. As in the one-dimensional graph, each line in this example has an arrow indicating the direction of increase.

These coordinates (the Cartesian coordinates) of the two-dimensional graph are also labeled, with the x-axis being the horizontal line and the y-axis being the vertical line. To define the point, start at the origin (the junction of the two axes). Move the x units horizontally, follow by the y units vertically.
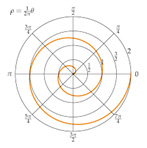
Two-dimensional graphing also includes polar coordinates and inequalities. Polar coordinates begin at the origin and go straight out to the point. Once the point is reached, the angle with the positive x axis is determined. The distance from the point of origin and the amount of rotation from the positive x axis then become the coordinates of the point (A).
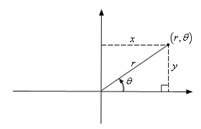
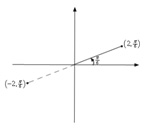
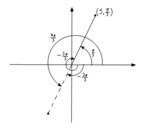
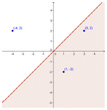
The r value can be both positive and negative (B). Using the equation r = 1, a circle is formed (C). Inequalities consist of variables, which when calculated, produce coordinates that are unequal in distance from the origin (D).
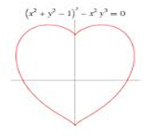
What all this means is that an inquisitive mind with a good graphing calculator can produce some interesting two-dimensional variations on the circle.
The Graphing Calculator And Three-Dimensional Thinking
Going from flat (1D and 2D) to fluffy (3 D) requires some out-of-the-box thinking and a graphing calculator that has three-dimensional capability. Those in the know recommend the Texas Instruments TI-83, TI-89, TI-92, and TI-Nspire models, or the Voyage 200 graphing calculator.
A three-dimensional graph represents one of two perspectives; it is either the graph of a function of two variables f(x, y) or the relationship among three variables g(x, y, z).
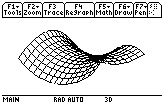
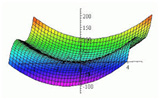
For example: the TI-89, TI-92, or the Voyage 200 graphing calculators would present the equation: z=y^2-x^2 as this three-dimensional graph.
If the coordinates are real numbers, the graph can be represented as planar or curved.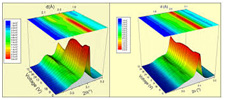
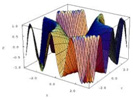
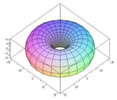
Three-dimensional graphs are usually drawn on a two-dimensional screen using perspective methods to create the three-dimensional effect. Colors on the graph are variable and can be applied based upon the design. Transparency and resolution are also customizable. Another avenue to explore is the ability to graph multiple three-dimensional graphs on the same axes.
The best option is to approach three-dimensional graphing with a creative spirit, an open mind, and a top-notch graphing calculator. If you do, you’ll find the possibilities are endless.
Ready for dimensional travel but don’t have the vehicle you need. SellYourCalculators.com can make an upgrade to a great graphing calculator as easy as 1, 2, 3. We are a premier buyback destination for used calculators. Our stellar customer service, quick turn around time, and competitive pricing will help make the purchase of a new graphing calculator less pain in the pocket.
Contact us today for more information on our graphing calculator buyback program.
59180 Views | 0 Comments | Category - news


